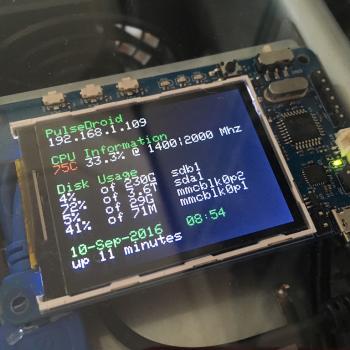
This is what my version looks like...it's a one page summary and isn't meant to be as comprehensive as the CloudShell script...
My script captures the hostname and IP address(es) (just IPv4), CPU temperature, utilisation and frequency as well as disk usage, server time and uptime - all one one screen.
I think there are parts of my script that work better than the DietPi-CloudShell for overall status purposes. The CPU utilisation is averaged across all of the cores and the frequency is averaged across the two sets of cores i.e. all A7 core frequencies are shown as one number, averaged across the 4 cores, and all the A15 cores are treated the same way. You will notice in the photos above an odd frequency of 275Mhz, that's due to the averaging.
To get this all working I initially followed the Odroid-Show2 examples. Setting up the TTY is simple and then it's just a matter of sending the right ANSI commands to the terminal.
Once it was all working, I added a cron job to update the display every minute...
crontab
* * * * * /root/status.sh
The script is available on GitHub here: https://github.com/ikromin/misc/tree/master/dietpi/odroid_show2
In case you missed it, I wrote about the software setup on my XU4 not too long ago. That covered DietPi, Plex, Deluge and webmin as well as a few other changes I made to the base system.
-i


