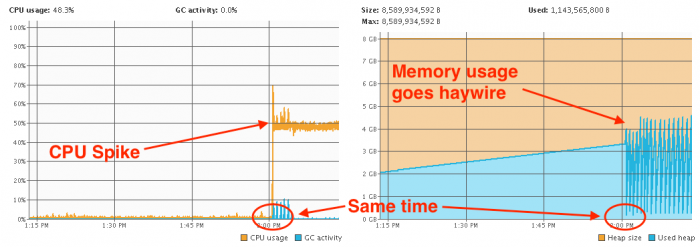
I was monitoring the managed server JVM using JVisualVM. On the hour the spike would occur. At the same time the CPU spike occurred, the heap was going haywire too...
So that wasn't normal! I did a thread dump and checked which threads were using the most CPU time (to find out how see this article - Troubleshooting high CPU usage for JVM threads). Everything pointed towards this...
Thread Dump
"Thread-7" prio=10 tid=0x00007fd414068000 nid=0x72ac runnable [0x00007fd454325000]
java.lang.Thread.State: RUNNABLE
at weblogic.store.io.file.direct.DirectIONative.unmapFile(Native Method)
at weblogic.store.io.file.direct.FileMapping.unmapView(FileMapping.java:192)
at weblogic.store.io.file.direct.FileMapping.mapView(FileMapping.java:162)
at weblogic.store.io.file.direct.FileMapping.remapViewInit(FileMapping.java:140)
at weblogic.store.io.file.direct.FileMapping.getMappedBuffer(FileMapping.java:210)
at weblogic.store.io.file.StoreFile.mappedRead(StoreFile.java:508)
at weblogic.store.io.file.Heap.read(Heap.java:989)
at weblogic.store.io.file.FileStoreIO.readInternal(FileStoreIO.java:305)
at weblogic.store.io.file.FileStoreIO.read(FileStoreIO.java:281)
at weblogic.store.internal.ReadRequest.run(ReadRequest.java:34)
at weblogic.store.internal.StoreRequest.doTheIO(StoreRequest.java:89)
at weblogic.store.internal.PersistentStoreImpl.synchronousFlush(PersistentStoreImpl.java:1086)
at weblogic.store.internal.PersistentStoreImpl.run(PersistentStoreImpl.java:1070)
at java.lang.Thread.run(Thread.java:745)
It looked like the persistent store was doing something...or at least something was trying to use the persistent store. After a bit of research I came across these two articles: here and here. I wasn't convinced that the issue I was facing was the same, but there definitely were similarities.
So I checked where the file store was meant to be according to configuration (Diagnostics > Archives > server)...

Default location! Great, this meant it would be in $DOMAIN_HOME/servers/$MANAGED_SERVER/data/store/diagnostics.
I checked the size of the file store and it was clocking in at 256Mb...
ls
-rw-r-----. 1 501 80 256M Sep 16 14:57 WLS_DIAGNOSTICS000000.DAT
This was big, but not as big as compared to the two articles I linked above. Still I thought I'd try the solution there to rename the WLS_DIAGNOSTICS000000.DAT file and restart the managed WebLogic server.
After a restart, the WLS_DIAGNOSTICS000000.DAT file was at a much smaller 1.1Mb size...
ls
-rw-r-----. 1 501 80 1.1M Sep 16 15:04 WLS_DIAGNOSTICS000000.DAT
-rw-r-----. 1 501 80 256M Sep 16 14:57 WLS_DIAGNOSTICS000000.DAT.OLD
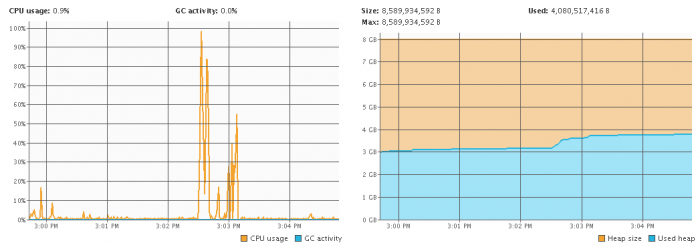
I was monitoring the JVM after the restart again. Like clockwork, there was some activity on the hour again, but this time after a short spike, all activity died down. The heap usage was also normal this time.
I did mention that this was happening "on the hour" and not "every hour". This was on purpose and I'll have a separate blog post about that too.
-i


